
Orders and sales
Analysis by customer, area, item, department or salesperson, with pending orders, delivery notes pending invoicing and yearly comparisons.
Business Intelligence
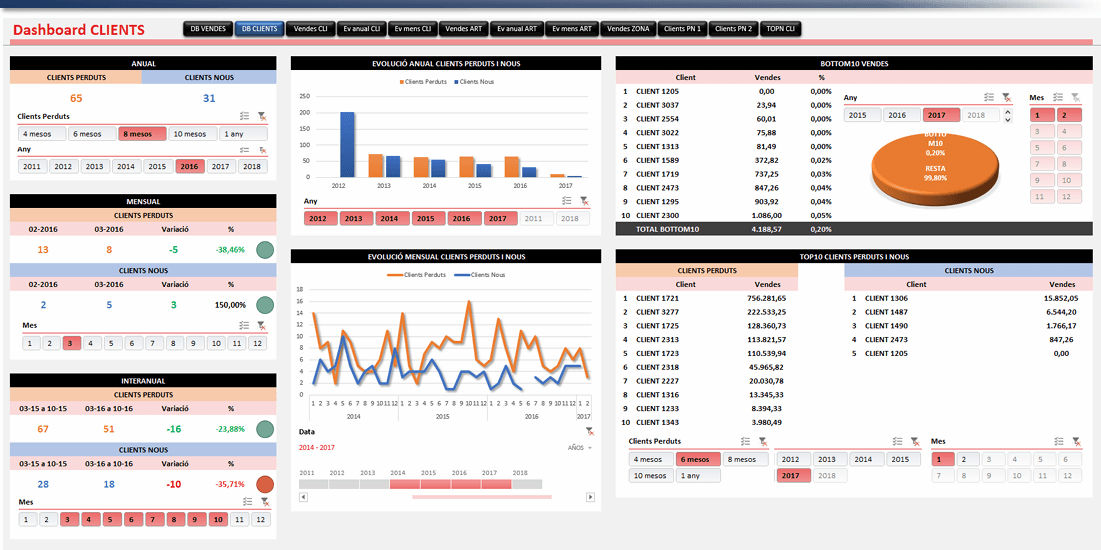
Holmes brings business data together in dashboards built with Microsoft Business Intelligence tools. It can consult information from multiple systems, refresh it in real time when the source allows it, and keep it compatible with Excel workflows.
See it in action
Business indicators ready to consult, compare and use for better decisions.
The problem
Many companies have useful data in ERP systems, databases, Excel sheets or internal applications, but analysing it requires too much manual work. Holmes was created to organise that information and make it easy to consult.
Data spread across Access, SQL, Oracle, web applications, Excel or other internal sources.
Manual reports that consume time and make it hard to compare the current year with the previous one.
Sales, orders, customers, margins, financials and stock analysed with different criteria.
Need to refresh information more quickly to understand business evolution.
Our answer
Holmes structures the main indicators into analysis blocks for management, administration, sales and operations. The information is ready to consult from different devices and can also be used with Excel.
Analysis by customer, area, item, department or salesperson, with pending orders, delivery notes pending invoicing and yearly comparisons.
Top customers, new, lost or recovered customers, items by customer and margins by customer, item, area, department or salesperson.
Profit and loss, balance sheet, ratios, budget, expense lines, stock valuation, shrinkage, batches and expiry dates.
How it works
Access, SQL, Oracle, web applications, Excel and other systems that allow data extraction or querying.
Data is turned into dashboards for orders, sales, customers, margins, finance and stock.
When the source and infrastructure allow it, data updates in real time; otherwise, at a defined frequency.
Review the dashboards from different devices and keep working with Excel when needed.
Requirements
Access to the data sources you want to connect (Access, SQL, Oracle, web applications or Excel).
Frequently asked questions
If you have a question you don't see here, write to us and we'll reply as soon as possible.
It can work with sources such as Access, SQL, Oracle, web applications, Excel and other systems that allow data extraction or querying.
Yes, when the data source and infrastructure allow it. In other cases, a refresh frequency is defined according to the process.
Yes. Holmes is designed to coexist with Excel and help teams keep working with data without rebuilding reports manually.
Orders, sales, customers, margins, profit and loss, balance sheet, ratios and stock, among other indicators that can be adapted to each company.
See it in action
We review what data you have today, what questions you need to answer and how Holmes can turn them into useful analysis dashboards.